| Understanding Sales Time Adjustments
|
| Before you begin you should input your subject property and comparable data before running the 1004MC analysis to calculate the Sales Time Adjustment in your 1004MC. In addition, you'll need a custom exported file from your MLS provider. If you do not have a custom export setup in your MLS, contact our
Technical Support department at 800-622-8727 to request guides on how to setup
your custom export and how to export your data from your MLS. |
| What’s New in Market Analysis
|
| We have enhanced the 1004MC (Market Conditions) service to now include Sales Time Adjustments. The GSEs want to better capture the monthly fluctuations in the market by requiring adjustments based on the market conditions at the time the comparable was sold. To fulfill this requirement, we are providing three options to calculate monthly time adjustments.
|
| Using Median Sale Prices groups in 30-day intervals (pseudo-months) from the effective date, you can now calculate a direct Monthly Adjustment, a Linear Regression Monthly Adjustment and a Non-Linear Monthly Adjustment. |
|
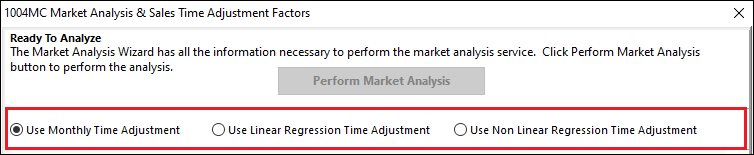
| To see the difference in the three analysis techniques simply click on the radio button next to each option. Depending on your market and your data along with any outliers that may be in the data, you will be able to visually select the method that best simulates your market conditions over the past 12 months. |
We have also taken this opportunity to enhance the overall operation of the 1004MC service. Here’s how to get started.
|
| User Interface Enhancements
|
- Open ClickFORMS
- There are two different ways to launch the 1004MC Service in ClickFORMS.
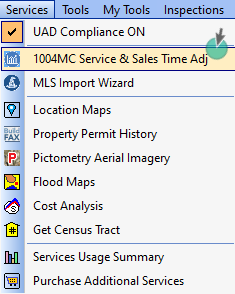
- Option 1: From the main ClickFORMS menu click on Services, then select 1004MC
Service.
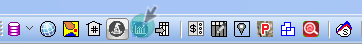
- Option 2: If you have the "Workflow Toolbar visable" (View → Show Workflow Toolbar) visible, simply click the 1004MC icon.
|
|
|
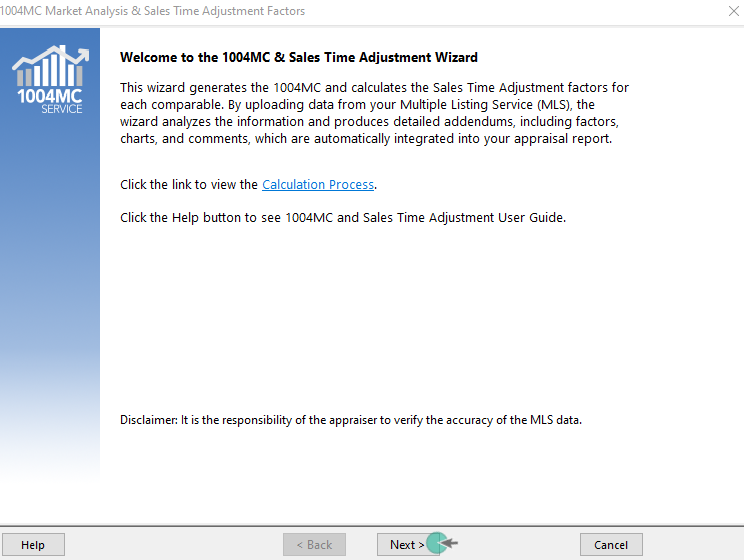
- When the 1004MC service starts up, you will see the Welcome Screen. We recommend that you review the Calculation Process and the User Guide if you are not familiar with this service.
Click Next to begin.
|
 |
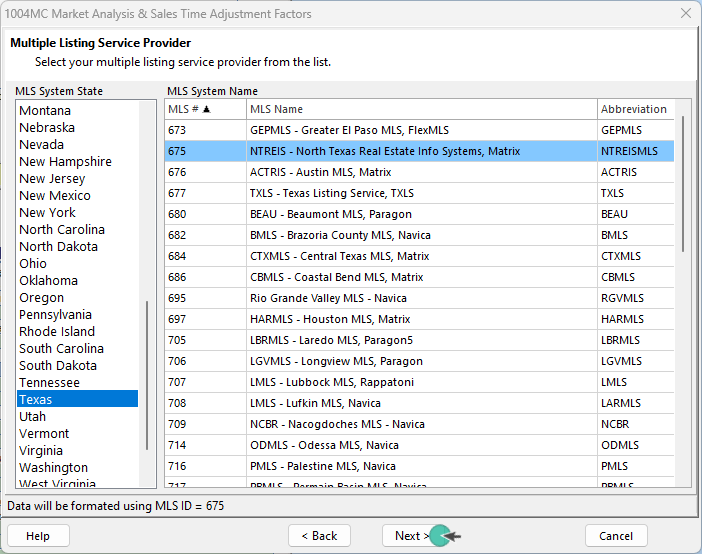
- The Multiple Listing Service Providers screen will appear. Choose your state and the MLS provider you use, then click the Next button. ClickFORMS will remember your choice. You can change it at any time if you use multiple MLS service providers.
If you do not see your MLS provider, call 800-622-8727 to have an MLS technician map your MLS for use with this service.
|
 |
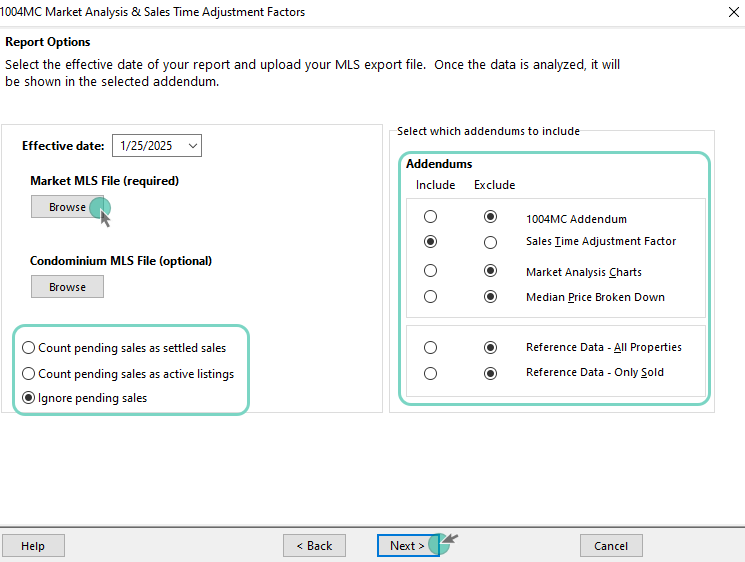
- Configure the options for the market analysis.
|
-
Verify the effective date is correct. It's pulled from your report.
- Import your MLS export file by clicking on the Browse button.
-
Import the condominium MLS data file if needed (optional)
-
Select if you want to consider Pending Sales as Settled or as Active Listings or Ignored.
-
Select what addendums you would like to have added to your report. If you are new to this service, select all of them so you can see what is available.
|
|
When complete, click the Next button to move to the next step where the analysis is performed.
|
 |
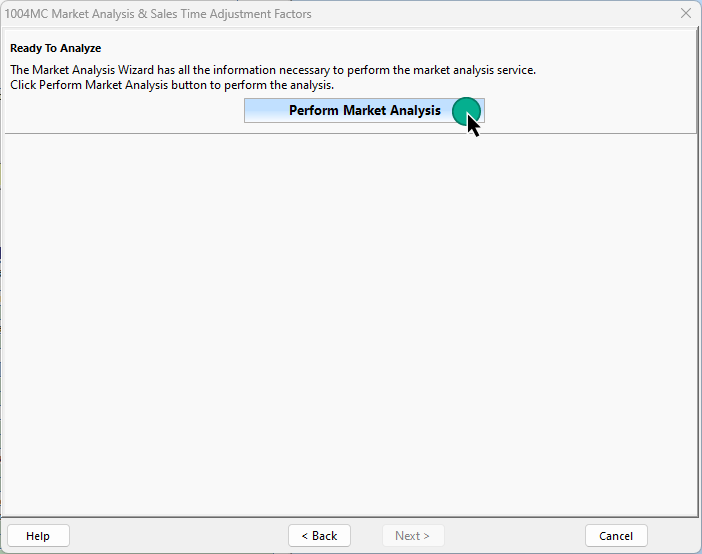
- Click the "Perform Market Analysis" button to start the analysis.
|
|
|
Understanding the Market Analysis Results
|
| Note: A sample MLS export file was used without removing any outliers and ignoring Pending Sales. Also, note that there are not many sales during the entire 12-month period. |
| Using the 1004MC analysis service, we can see that the Median Sales Price for the three time periods shows a decline, (545K, 582K, 556K). If you plot these points, you will get a sharp decline in the last period. |
 |
|
|
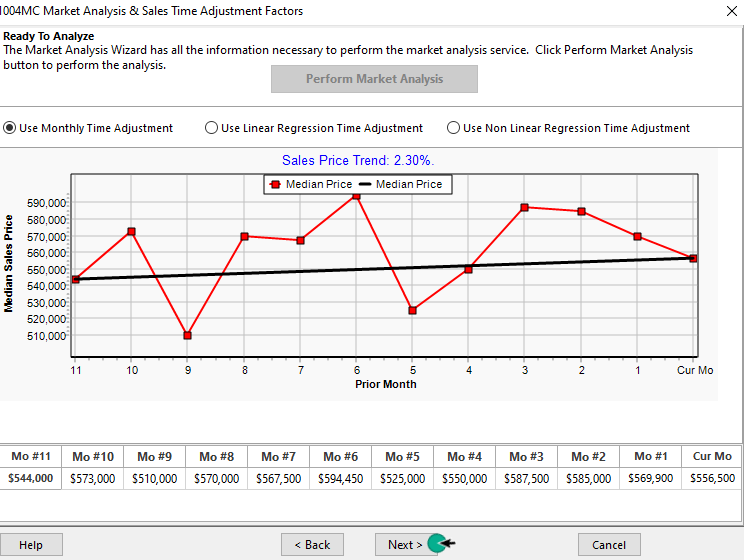
Option 1: Monthly Time Adjustment
|
| However, if you calculate and plot the Median Sales Price on a monthly basis (30-day intervals from the Effective Date) instead of the 7-month, 3-month and 3-months periods of the 1004MC, you get a very different plot as shown below. |
| There are a couple of possible reasons for this. The sales data is sparse and the median does not reflect the average sale price or possibly Pending Sales should not be ignored. Regardless, it's easy and quick to rerun the analysis using the different options for how to handle Pending Sales. |
|
To determine the Monthly Adjustment Percentages and Factors, click the Next button.
|
 |
|
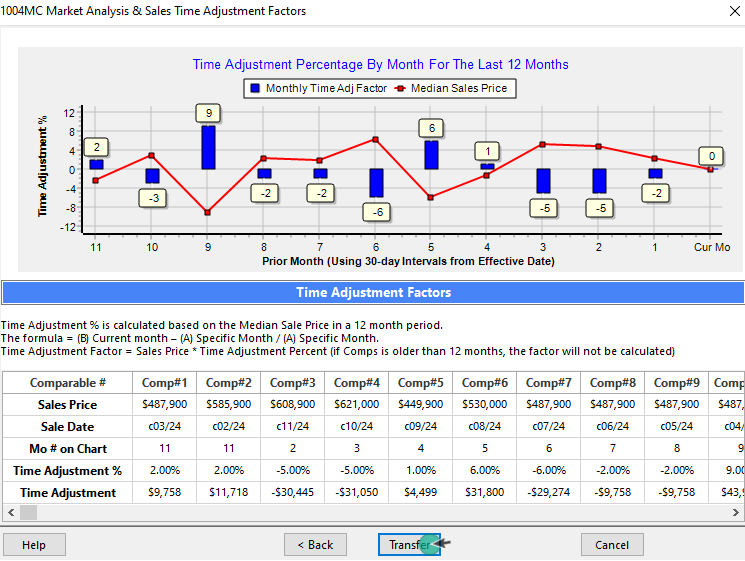
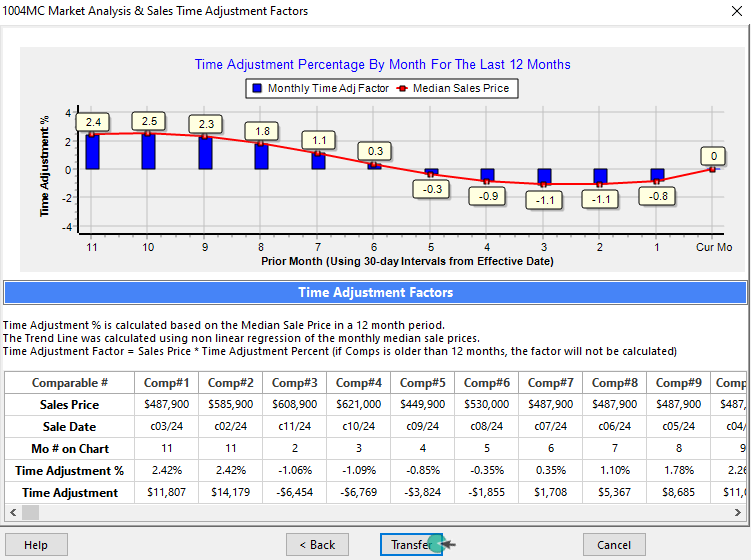
The Monthly Adjustment Percentages are calculated. Comps (contract date or Settled date) and Sale Prices are auto-loaded and the Adjustment factor calculated. When you click the Transfer button, the factors will be applied in the Sales Grid and the specified Addendums will be created and added to your report.
|
 |
|
Option 2: Linear Regression
|
|
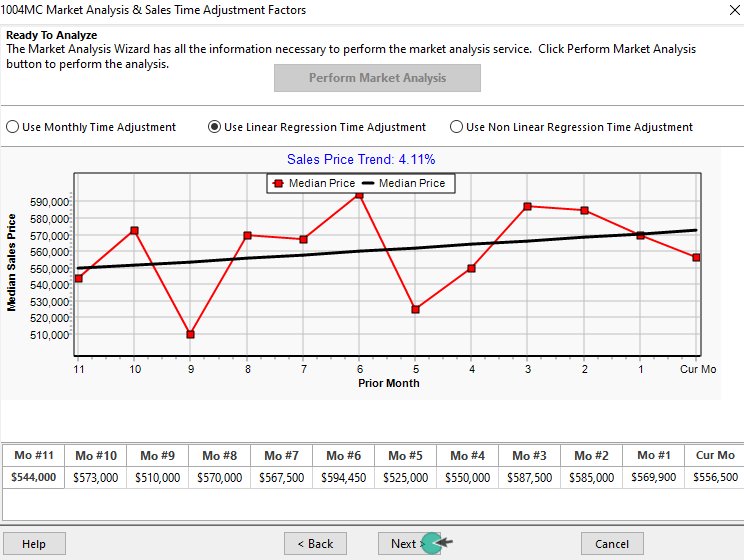
The second option is to use Linear Regression to determine the Sales Trend by determining a line (linear) that that best fits the data points. Selecting this option produces the following chart. As you can see, a straight line does not represent an accurate representation of the market conditions portrayed by the Monthly Median Sale Prices.
|
|
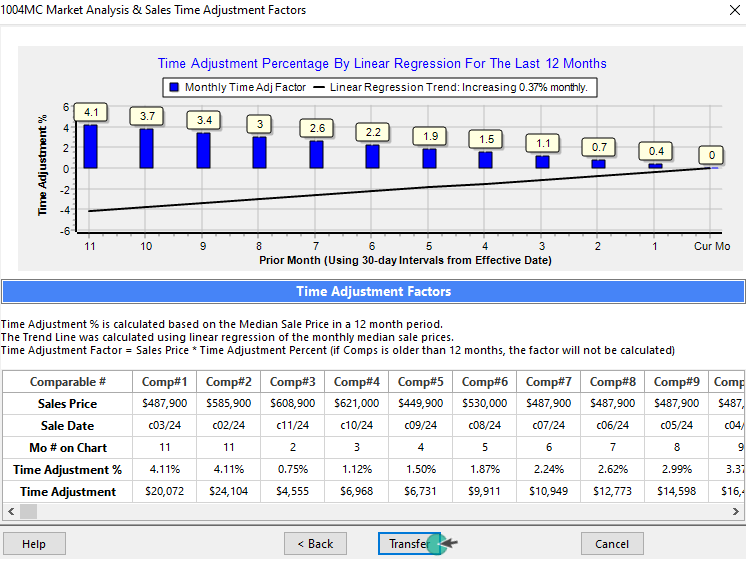
If you know your market is very stable, you can remove any outliers from your data set until you get less variation in the monthly data points. You can also rerun the analysis and test the results using different Pending Sales options. When you click the Next button, the Adjustment Percentages and Factors will be auto-calculated for you.
|
|
|
Clicking the Transfer button, the factors will be applied in the Sales Grid and the specified Addendums will be created and added to your report.
|
 |
|
Option 3: Non-Linear Regression
|
|
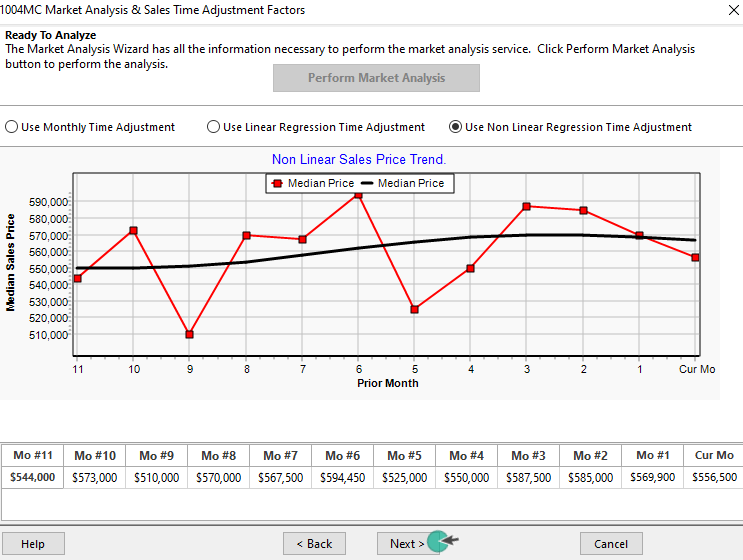
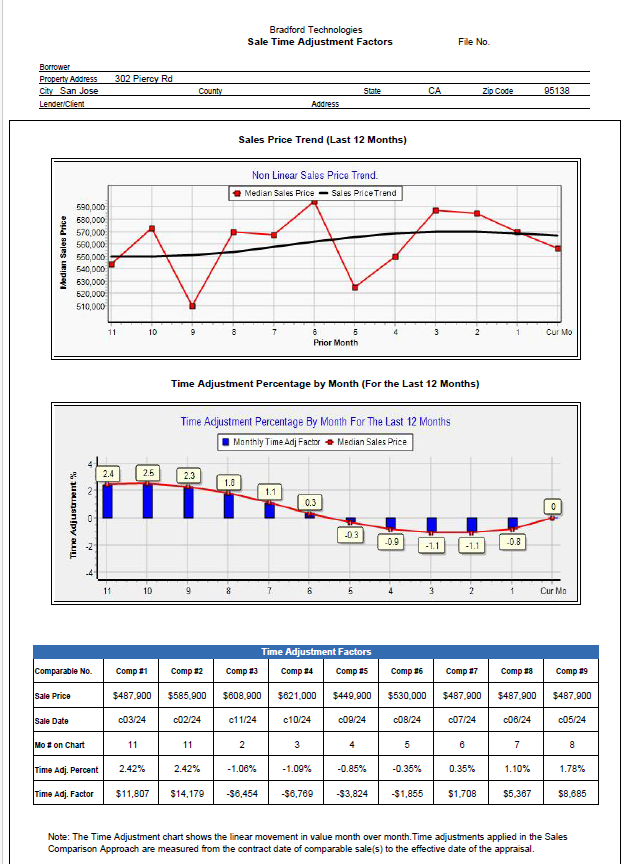
The third option is to use Non-Linear Regression to determine a curved line that best fits the data points. Selecting this option produces the following chart. As you can see, non-linear regression produces a much better fit than linear regression. The straight line of linear regression does not accurately represent the market conditions portrayed by the Monthly Median Sale Prices.
|
|
When you click the Next button, the Adjustment Percentages and Factors will be auto-calculated for you.
|
 |
|
When you click the Next button, the Adjustment Percentages and Factors will be auto-calculated for you.
|
 |
|
Whichever method you choose to use will depend on your judgement of the market. Was it fluctuating monthly, was it stable with a steady increase, were there outliers in particular months that are incorrectly influencing the monthly adjustment rate? Only you can determine which is best. This is why we are providing three methods to calculate monthly time adjustments.
|
|
Whichever method you decide to use, the new 1004MC Service with Sales Time Adjustments will automatically calculate the time adjustments factors for you and transfer them to the Sales Comparison Grid, just make sure you have your appraisal report open at the time you perform the analysis.
|
|
The new addendum with Sales Time Adjustment Factors addendum is shown below.
|
 |
| ClickFORMS 1004MC Service
|
|
The 1004MC Service is included in the ClickFORMS Gold Plus and Platinum Memberships. It is also available for purchase separately from the AppraisalWorld store.
|
|
The 1004MC Service improves your report by adding detailed charts that visually explain market trends. These charts come with automatically generated comments that you can edit as needed. With the new Time Adjustment feature, you can now apply Sales Time Adjustments to reflect monthly market changes, as required by GSEs. This ensures that comparable sales are adjusted based on market conditions at the time of sale. This requirement takes effect on March 1, 2025.
|
|
For more information, visit our website or call us at 800-622-8727.
|