| What's New — Appraisal Bulletins |
|
| September 24 2025
|
|
|
|
| It's the Right Time |
| Jeff Bradford discusses the inflection point created by Freddie Mac and Fannie Mae. This becomes the time to decide what the Appraiser of 2030 is going to be like. What is your vision for the Appraiser of 2030? (It's not that far away) |
| Read the Article |
|
| IMPORTANT NOTICE FOR APEXSKETCH USERS |
| Apex Software has informed us that the latest Microsoft update (KB5064081) for Windows 11 has broken ApexSketch v6 and v7. Apex has made Microsoft aware of the issue. |
| To address the issue for now, there is a new update available for ApexSketch™ v7 that addresses the issues caused by the recent Microsoft Windows 11 Update. Download it using the following link. It is recommended that you restart your computer after the installation. |
| https://www.apexwin.com/voxtur/ |
| Apex is recommending that users on version 6 should upgrade to ver. 7. If this is not a feasible solution for you, you will need to contact Apex at 1-888-308-2722 for alternative solutions for ver. 6 software. |
|

|
| It's time for an update! The appraisal industry is on the verge of the most significant changes and opportunities for appraisers that we've seen in decades. Recently, Jeff Bradford presented an update on our new, innovative software NightHawk. Jeff discussed: |
- UAD 3.6 milestones and the GSE schedule
- NightHawk Software Status
- NightHawk release schedule
- Results from our recent UAD 3.6 Limited Production participation survey
- UAD 3.6 and NightHawk Education Initiatives
- Answered some questions from our audience
|
| Watch this video for an informative look at NightHawk and the future of appraisal software. |
|
|
|
The New Appraisal Report:
How One Company Is Rethinking Appraisal Software
|
| Interview with Jeff Bradford in the latest Appraisal Buzz online article
|
| "How are appraisal software providers retooling their products for UAD 3.6? One provider, Jeff Bradford, CEO of Bradford Technologies, shares his thinking." Bryan Reynolds goes on to say, "I want to talk about a video from late last year that's gotten a lot of attention, even from the GSEs. I think it struck a chord. So, let's talk about what it is, who created it, and why".
|
|
→ Read the full article in Appraisal Buzz
|
|
NightHawk™ — Seizing the Opportunity of
UAD 3.6 Changes
|
| It's often easy to remember where you were and what you were doing with monumental events in history like the first man on the moon or the events of 9/11. Small changes happen all around us and they have a more cumulative effect on our lives. So it has been with changes in the appraisal industry and how we present our reports. For years we have seen layer upon layer of changes to standardized forms, but they have largely remained constrained by the physical dimensions of a sheet of paper and legacy entry methods that reach back to the typewriter. Now we're looking at UAD 3.6 and the seismic shift in appraisal reporting — no more forms!
|
| At Bradford Technologies we saw an opportunity for us as software developers to stop building upon the layers of the form. Some developers have addressed the UAD 3.6 changes by adapting forms software to the new report process. It's like the old adage of "To a hammer, every problem looks like a nail." As an appraiser, you have specific skills and expertise that are not reflected in the tedious task of filling out a form. The new UAD 3.6 no longer uses forms in the final report submission, so why should you continue wasting time on forms?
|
| To address this transformative change, we set out to build new software, NightHawk™, to empower appraisers to use their experience in a new, streamlined valuation process that shifts time from form filling to analysis and building supportable valuations. This is the opportunity presented by the change coming to the appraisal industry and this will be the inflection point we'll all remember in the years ahead that returned a standard of excellence and ended wasteful form filing.
|
| Now, let's take a look at some specific sections of NightHawk that we believe will really enhance the appraisal workflow to help you work faster and smarter:
|
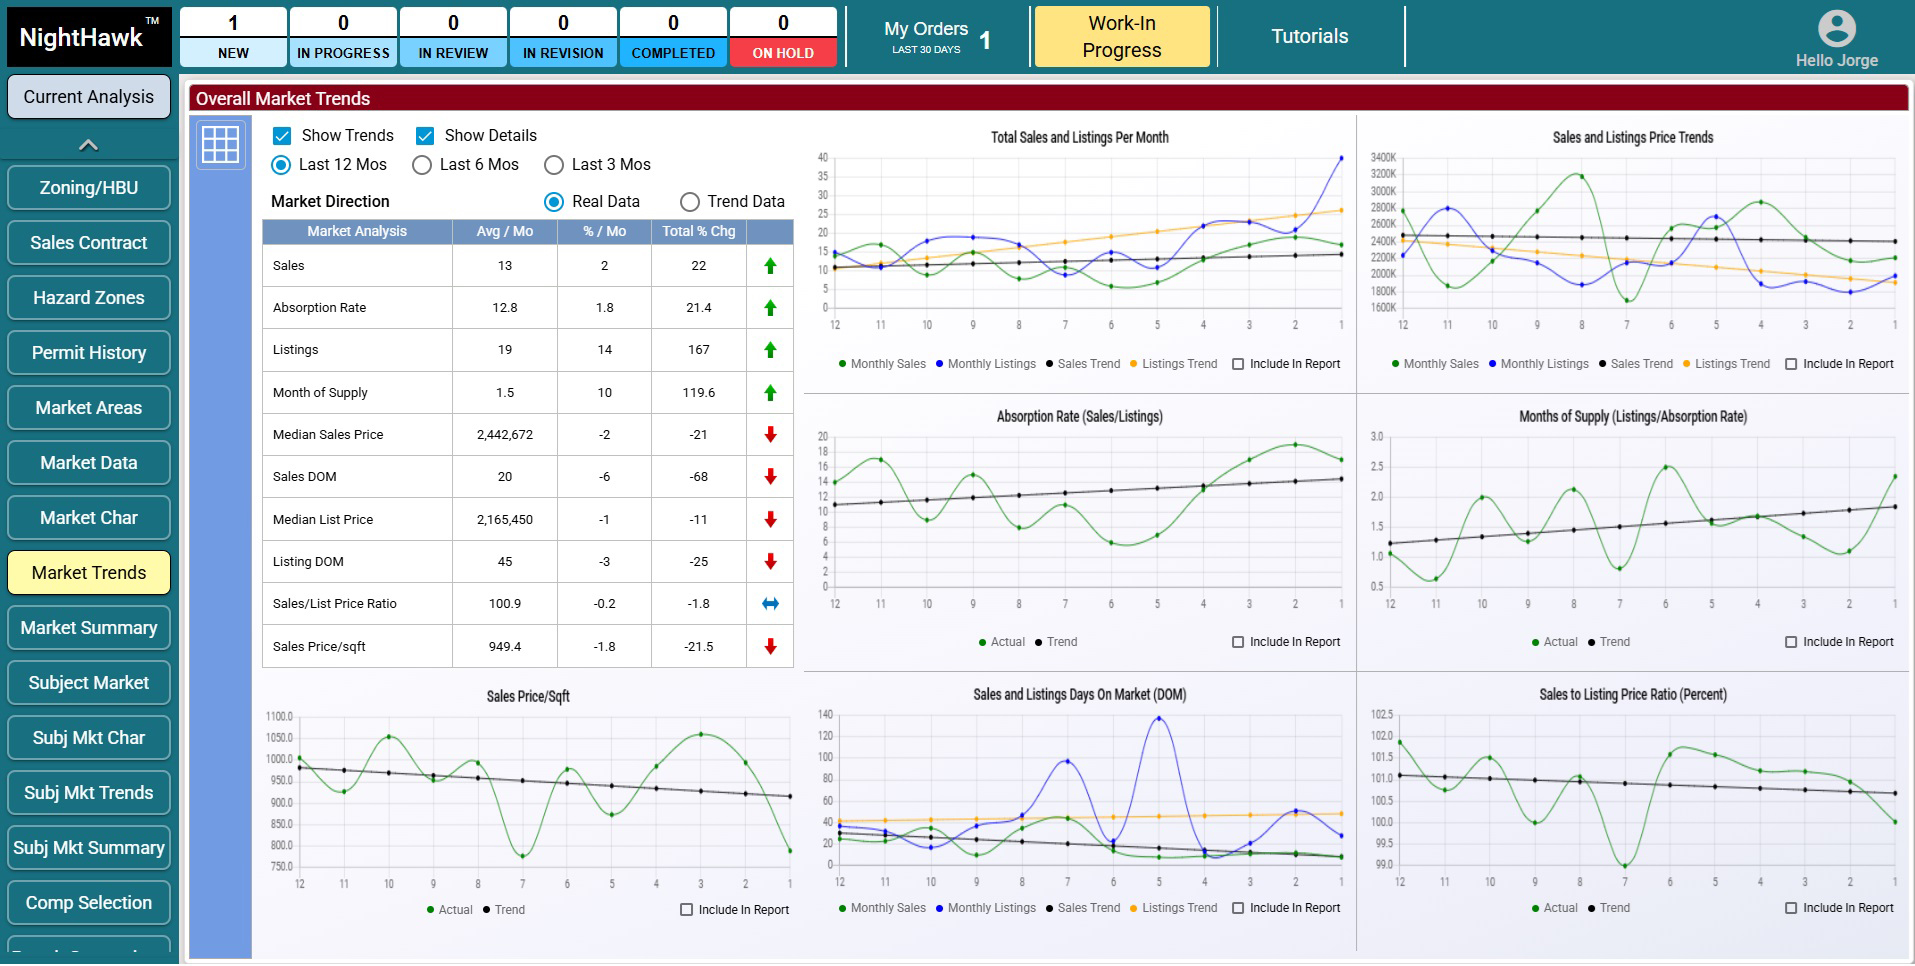
| Market Trends
|
|
| Overall market trends show informational charts and graphs such as Day on Market, Sales and Listing Price Trends, and more in an intuitive dashboard so you can easily see what is going on in the market.
|
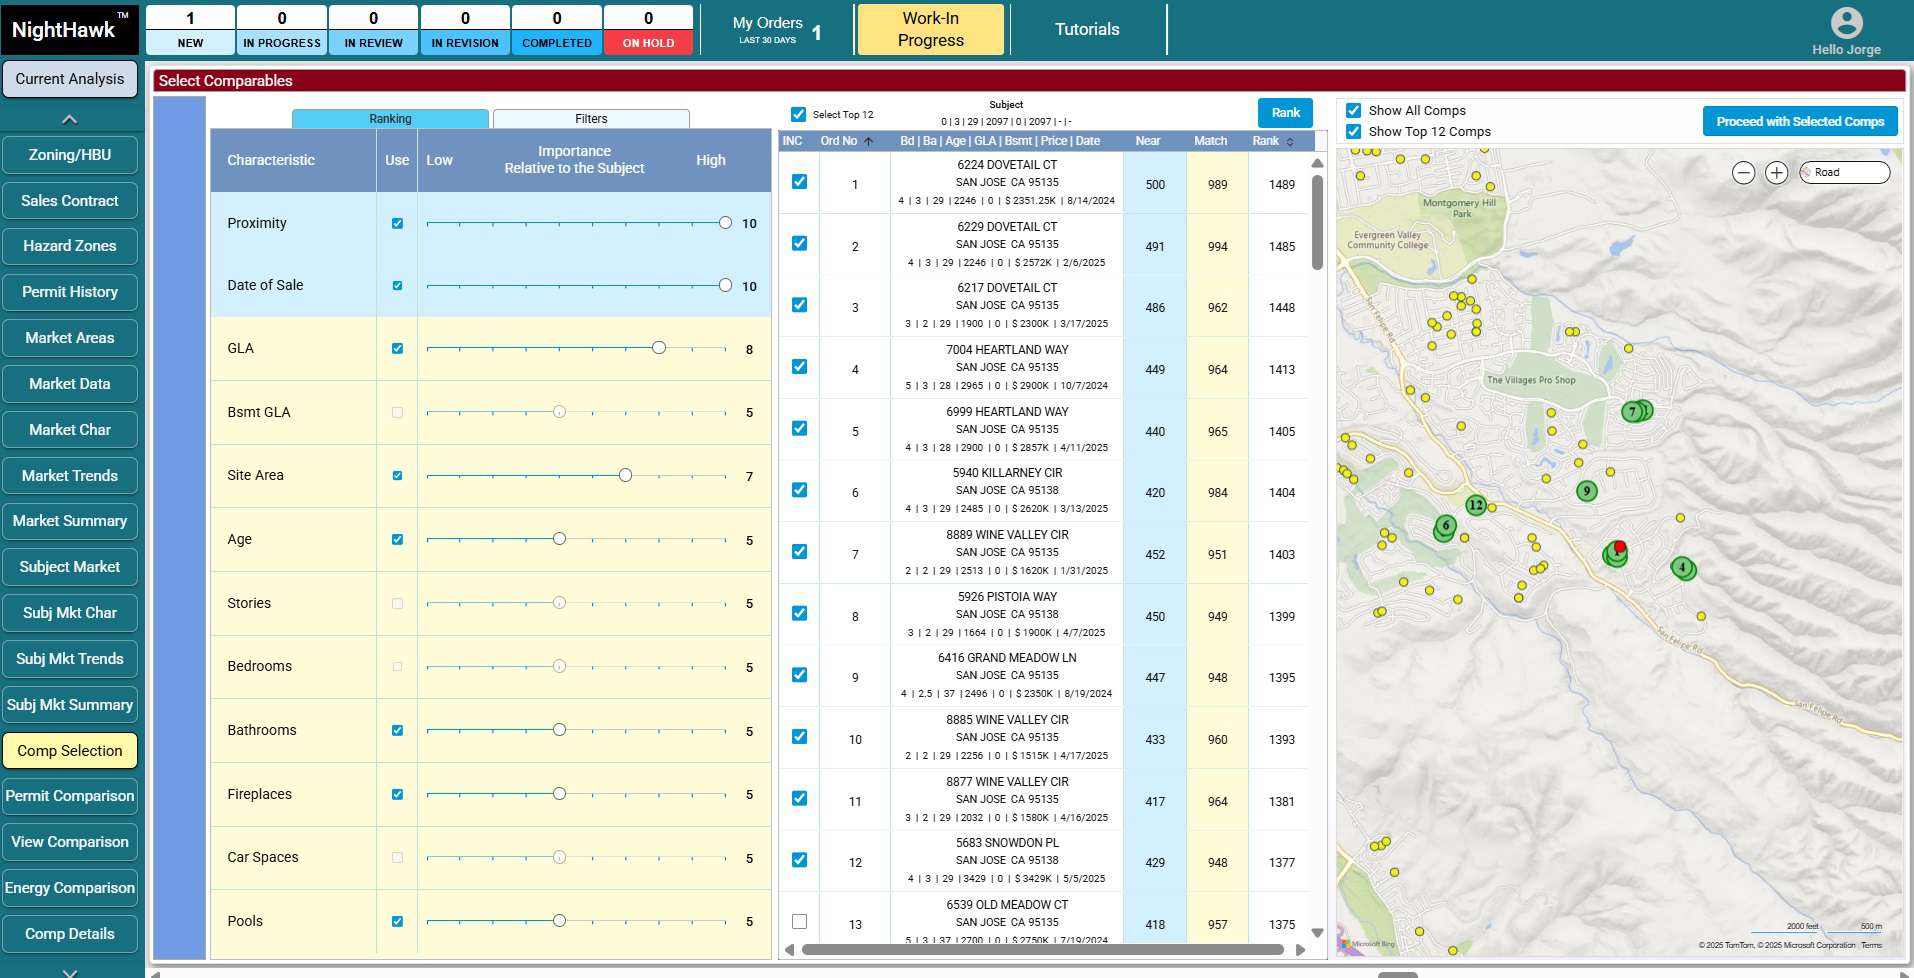
| Comp Selection
|
|
| Selected comps can be ranked based on certain characteristics, based on these rankings, NightHawk can even suggest the order of the comps.
|
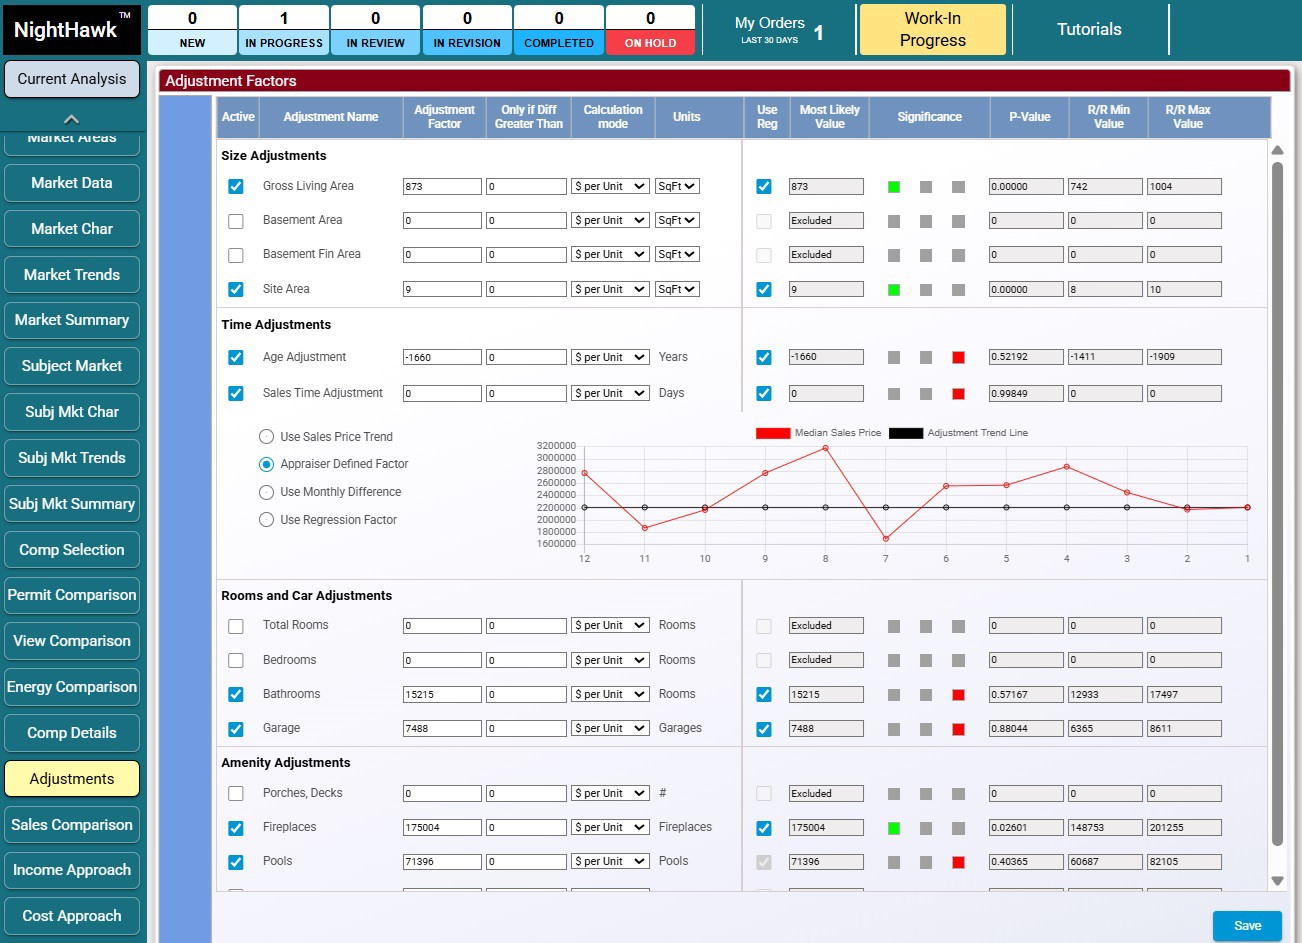
| Adjustments
|
|
| NightHawk suggests Adjustment factors based on statistical analysis.
|
| Of course there's much more to NightHawk, but we hope this whets your appetite for NightHawk and the changes coming to the appraisal process. We think this will be the Valuation industry's "Remember when" moment. To keep up with the latest on NightHawk's progress, be sure to sign up for all the news and updates. If you haven't watched Jeff Bradford's introduction video, watch that here: Video
|
| If you have questions or comments, please use this NightHawk comment form:
|
|
|
|
Must Watch Video Looks to Future and UAD 3.6
Jeff Bradford Voted "Mentor of the Year"
|

|
| Jeff Bradford was voted "Mentor of the Year" in the inaugural Buzzy Awards competition held by the Appraisal Buzzcast. Watch this episode as Jeff joins Hal Humphreys and Jim Morrison as they reflect on Jeff's journey in the appraisal industry. They also look to the future of valuation with UAD 3.6 and the end of traditional appraisal forms and what this means for appraisers and appraisal software.
|

|
Watch the Buzzcast on YouTube
|
|
| Fannie Mae and Freddie Mac New 3.6 UAD Resources
|
| Fannie Mae 3.6 UAD Resources
|
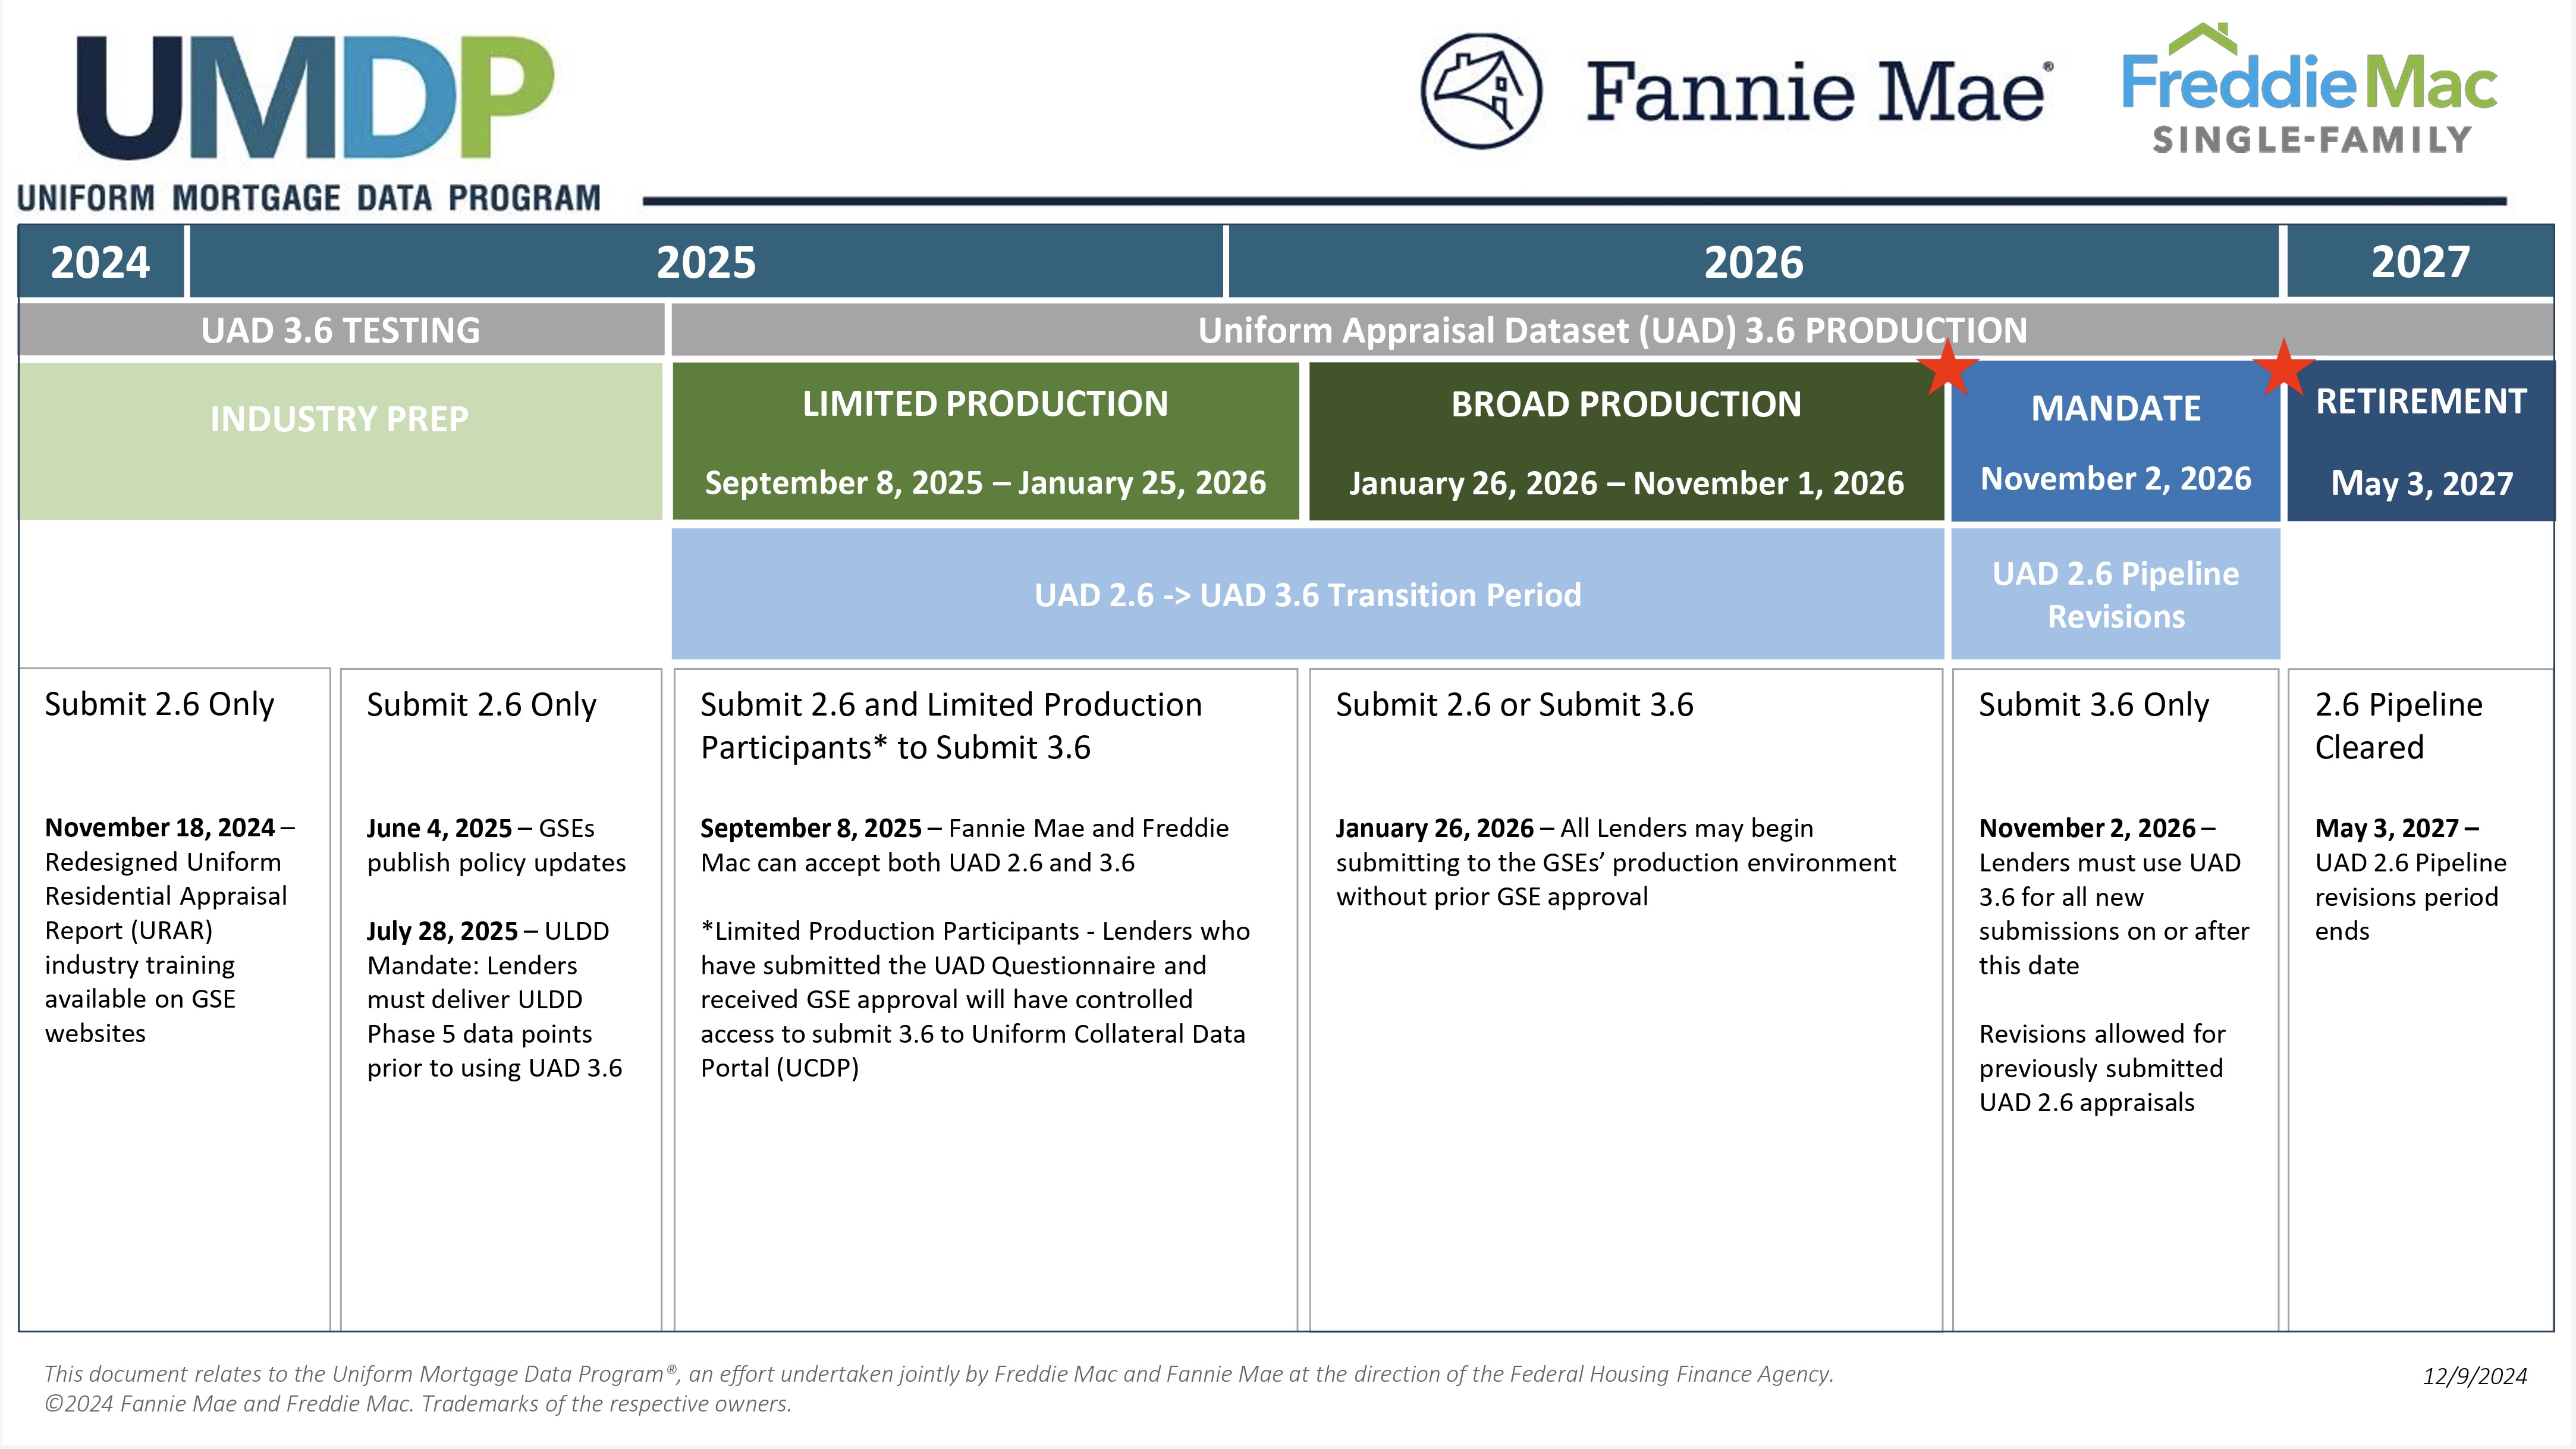
| UAD 3.6 Release Timeline (Hover over image to enlarge) |
|
|
| Questions and Answers - UAD and Forms Redesign |
| Sean Murphy, Freddie Mac Single-Family, Credit Policy Risk Analytics Manager and Ken DeFeo, Fannie Mae Single-Family, Credit Risk Senior Manager answer common questions |
| Fannie Mae Frequently Asked Questions |
| Answers to frequently asked questions about the new UAD 3.6 |
| UAD Documentation |
| UAD 3.6 announcements, documentation and resources |
| Freddie Mac 3.6 UAD Resources
|
| UAD Documentation |
| The UAD 3.6 and Forms Redesign team have developed new and updated existing documentation to support ongoing implementation efforts. |
| Freddie Mac Frequently Asked Questions |
| Frequently Asked Questions about the Uniform Appraisal Dataset (UAD) 3.6. |
|
|
|
|
|
|
|
 |
We use GoToResolve to remotely access your PC to help troubleshoot technical difficulties. GoToResolve is safe, secure and requires permission from you before our Technical Staff can assist remotely.
Click here to download GoToResolve. |
| |
|
|
|
Thanks for supporting us.
Drive carefully while you are out inspecting and don't forget to tell your friends about ClickFORMS.
|
|
 |
Bradford Technologies, Inc. 302 Piercy Road, San Jose, CA 95138 |
(800) 622-8727 | info@bradfordsoftware.com |
| © 2024 Bradford Technologies. All Rights Reserved. No part of this document may be reproduced in any form or by any means without the written permission of Bradford Technologies. Information in this document, including specifications of products, services and prices are subject to change without notice. |
| |
|
|
|